What the Maps Miss
By Benjamin M. Schmidt
On January 31, American Experience premiered The Race Underground, which explores the creation of the country’s first subway system, in Boston. Since those early days, subways have become a dominate feature of urban life, and most residents can picture the map of their city’s subway system with their eyes closed. But how do these omnipresent subway maps shape the way we see our cities? Historian Benjamin Schmidt decided to find out.
Geographers like to talk about the "mental maps" people use to navigate cities, which are often quite different from strict geography. Some places loom large in the imagination, some distances seem small; for every person, this differs. Subway maps are interesting because they represent a shared component of almost everyone's mental map of the city: most Bostonians spend a lot of time looking at the T map to figure how to get around, and it inevitably shapes our associations of how the city fits together, and how you can get around it.
Since we think of cities in terms of their subway maps, I wanted to see what it would look like to distort them to fit on an actual map. It's easy to display the lines on Google Maps, of course, but I wanted to keep all the trappings of the real T map, down to the labels for the stations. I was able to do this in the mapping program QGIS using a process called "georectification" that historians use to position historical maps, and engineers use to position paper schematics into digital sources. Imagine if you took a stretchy, rubber version of the subway map and then pinned each individual station onto a geographically accurate map. The individual stations would be in the right place, but the rest of the rubber would stretch out or scrunch up based on how distorted the subway map is: that's essentially what you see below.
The result is that the places where the T map has to be distorted the most show where our mental maps might be out of sync with strict geographic space. (Which isn't to say that they're wrong! Particularly for everyone who uses the T to get around.) Areas that look small in the distorted version are too big in the T's map, and maybe in our imaginations. This is most notable around downtown, but also apparent in a few other directions, particularly around where I work, at Northeastern University, where the Orange and Green lines are practically next to each other in real life. All these places seem "small" or "reduced" in the distorted version of the subway map, but that’s just a reminder of how big a role they might play in our heads.
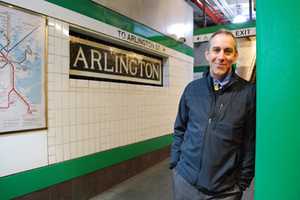
Benjamin Schmidt is an assistant professor of history at Northeastern University and core faculty in the NuLab for Texts, Maps and Networks. To learn more about his work, visit benschmidt.org.