|
Read
Peter Webster's explanation of what the data worldwide are showing, excerpted
from his interview with NOVA scienceNOW. Then take a look at data he and
colleagues published in a September 2005 paper in Science entitled
"Changes in Tropical Cyclone Number, Duration, and Intensity in a Warming
Environment."
Webster: The bottom line of our study is that we found a consistency
between the increase of surface temperature in all of the oceans and a change
in intensity to more intense storms. Now, if it were natural variability, what
one would expect to find is that the variation would be different in each of
the basins. I think the first conclusion, perhaps the most important one, is
that the characteristic change to more intense hurricanes is a global
phenomenon and not a local phenomenon.
Kerry Emanuel went back into the data further than we did, roughly from 1950
onwards, both in the Atlantic Ocean and the North Pacific Ocean, and he found a
very, very strong association between intensity of storms and the increase of
sea surface temperature, much the same as we did. We also looked at the other
ocean basins, the South Pacific and the South Indian Ocean. The Southern
Hemisphere accounts for roughly 30 percent of all the storms, so we wanted to
make sure we were doing a global study. And these two different studies using
some common overlap data but different regions tend to support each other quite
well.
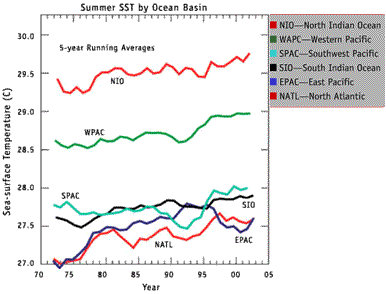
Sea Surface Temperature
Since
1970, sea surface temperature (SST) in tropical regions of the world's oceans
has been on the rise. While the average rise, roughly 0.5ºC, may seem
slight, this extra heat in trillions of tons of water amounts to a vast reserve
of energy. And it is well known that hurricanes draw on warm-water energy to
gain strength. The graph above charts SST in particular ocean basins during
their tropical cyclone seasons.
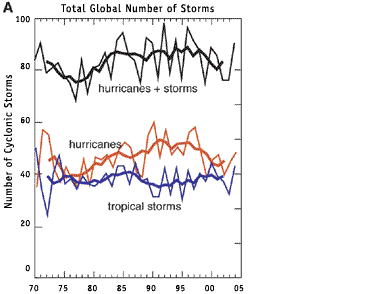
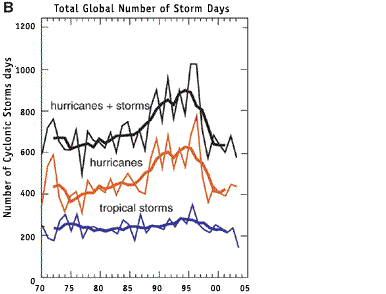
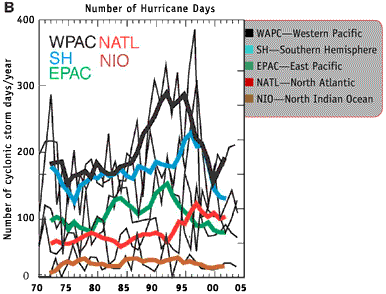
Global Number and Duration of Storms
Has
the global rise in sea surface temperature spawned more hurricanes and tropical
storms worldwide or increased the total number of storm days? Webster and his
colleagues conclude not. They found no long-term upward trend over the past 35
years, only natural ups and downs. In the graphs above and below, the thin
lines chart year-by-year variability; the bold lines show the five-year running
averages.
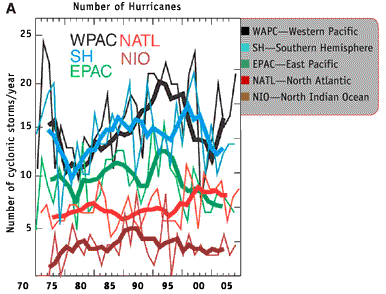
Regional Number and Duration of Storms
Looking
at specific ocean basins, Webster's team again doesn't see long-term upward
swings in the annual frequency of hurricanes and total number of storm days.
The exception, though, is the North Atlantic, where storm numbers and durations
have surged since 1995. Some researchers have speculated that this increase is
due to global warming, but Webster doesn't think such a simple attribution is
warranted. If global warming and related rising sea surface temperature alone
led to more hurricanes and storm days, then one would expect to see an upward
trend in other ocean basins.
Hurricane Intensity
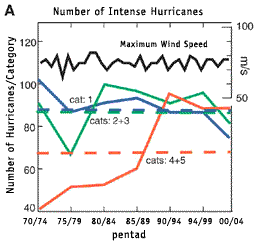
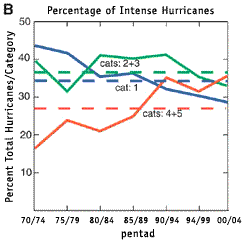
Hurricane
intensity—whether a storm ranks as a Category 1, 2, 3, 4, or 5—is
based on wind speed. As the graphs above show, the number of Category 4 and 5
storms has nearly doubled in the past 35 years. This upward trend occurs in all
of the ocean basins Webster's team examined. There has not been a change in the
maximum wind speed of the most intense storms (black line). Yet overall,
hurricanes have indeed grown more intense—and potentially
destructive—in recent decades. (Note: The horizontal dashed lines in
both graphs show 1970-2004 averages.)
|


